The iNet AirPort Monitor
The AirPort Monitor is a tool to view and control the connection quality of the connected devices as well as to show the data throughput through the discrete interfaces.
In addition you find a lot of detailed information regarding the AirPort station and the connected clients.
Topics covered on this page:
To choose an AirPort station for monitoring:
-
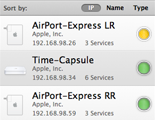
Click on one of the displayed AirPort stations.
-
The bulbs represent the condition of the AirPort stations:
 Airport station works ok,
  Airport station is misconfigured
 -
If the bulb does not show green, please use Apples AirPort Utility to reconfigure the AirPort station (use the button at the top right corner of the iNet window).
To monitor the network traffic on a station:
-
Click on ‘Network Traffic‘. The different interfaces of the AirPort station are shown below.

-
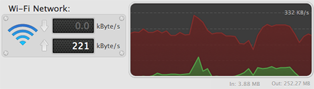
The WiFi interface shows the overall incoming (green) and outgoing (red) wifi traffic. The current traffic is numerically displayed on the left side of each graph.
-
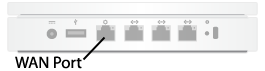
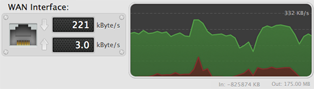
The WAN interface graph shows the traffic through the WAN port between your local network and the internet, if the Airport station is directly connected via e. g. a cable modem to the internet.
-
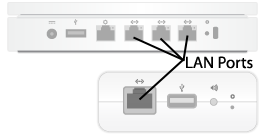
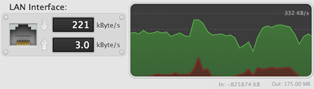
The LAN interface graph shows the traffic through the LAN ports.
To set the scaling of the graphs:
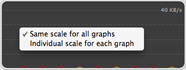
The scaling of the graphs is computed in realtime. Yo can choose between "Same scale for all graphs" and "Individual scale for each graph".
-
Same scale means that the same heights of the displayed graphs represent the same throughput on all displays. The interface with the maximum throughput defines the maximum height of all graphs. This means that If the throughput differs very much on the discrete interfaces this may lead to a less-usable display on at least one of the graphs.
-
If you choose individual scaling, every interface graph uses the full height of the graph space as the current maximum for the individual interface.
To monitor the connection quality of the wifi-clients:
-
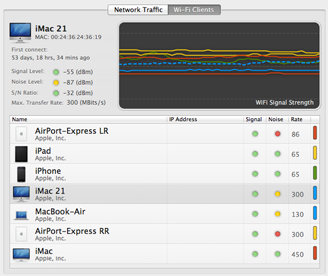
Click on 'Wi-Fi Clients' to see the wifi clients screen.

-
The wifi clients view shows the current connection quality for each of the connected devices in realtime. The connection quality is determined by the signal strength and the noise value.
-
The current levels can be displayed as number values or as green (good), yellow (acceptable) and red (bad) light bulbs (use ctrl-click on the bubbles to change the display).
-
The signal level tells you there is an Airport station connected and working. The higher the better.
-
The noise level tells you how much interferences (or background noise) exists on the channel through which your device receives the data. The lower the better.
-
The signal to noise ratio (S/N Ratio) shows the relationship between the desired signal (or data) and the background noise. It represents the ratio of useful information to false or irrelevant data. The higher the better.
-
The maximum transfer rate is mainly limited by the used network adapters and the signal quality. The overall signal quality is represented by the signal and noise level. The higher the signal quality, the more data is being received without having to use data correction methods. The lower the Signal Quality, the more data correction methods are used. There comes a point that the signal quality is so low that the receiver can't correct all the data errors.
-
To easier identify a wifi client in the graph the lines are colored. The colors of the line graphs are the same than the colors at the right column of the client list. If you click on a client in the list its "wifi quality line" gets dotted.
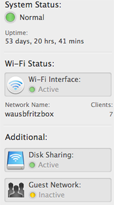
Monitoring the overall system Status
The table on the right side of the AirPort Monitor screen shows some details about the overall system status of the monitored AirPort Station.
-
The system status bulb represents the overall status of the monitored Airport station. If it shows yellow or red you have to use Apples Airport Utility to identify whats wrong.
-
Uptime means the time the chosen Airport station is working without interruption since its last shutdown (or reboot).
-
If the wifi interface bulb shows green the wifi interface of the chosen Airport station is active; otherwise there may be none or only an ethernet connection active.
-
Disk sharing means that the build in hard drive of the Airport station is shared.
-
An active guest network means that your Airport Station makes a (second) wifi network available that can be used to access the internet but not to access other devices in your network (like file sharing or remote access).
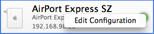
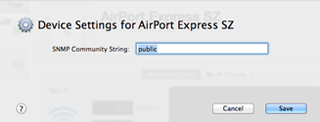
Setting the SNMP community string in iNet:
The SNMP community string is like a keyword or a user identification that allows access to the statistics of a router like an AirPort Base Station. If the string is incorrect the router refuses to answer.
-
Ctrl-click on the item you want to change.
-
Change the SNMP community strings to your needs.
-
Save your settings.
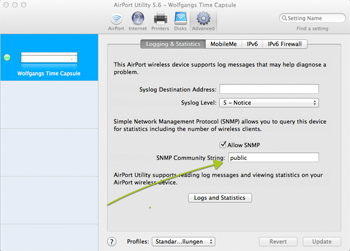
Setting the SNMP community string in AirPort Utility:
Since the update to version 6 of the AirPort Utility it is not possible to set or change the community string. If you must set or change the string please download the 5.6 release from here: (download from Apple). This seems to work even if a message like "not compatible with base station" is shown.
-
Open AirPort Utility and switch to the "Manual Setup" -> "Advanced" tab. Enter your community string (standard is "public")
-
Quit AirPort Utility. If iNet cannot detect the AirPort station please restart the AirPort (completely remove the power cord for at least 15 seconds).